Article Provided By: Kenneth Vierra (Cherokee Nation Strategic Programs/UxS Research Transition Office), Gijs de Boer (NOAA PSL/CIRES/CU) and Janet Intrieri (NOAA/PSL)
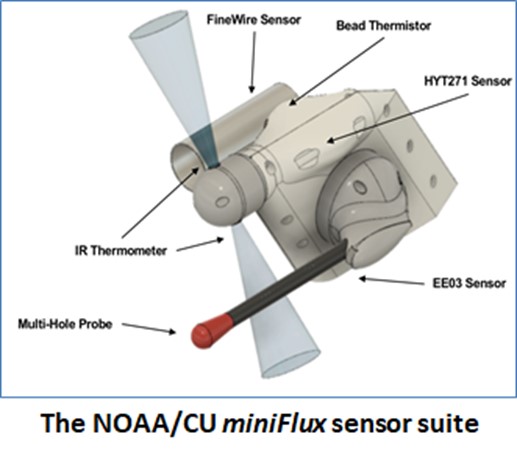
With funding and logistical support from the NOAA Oceanic and Atmospheric Research (OAR) Uncrewed Systems Research Transition Office (UxSRTO), in addition to the NOAA Pacific Marine Environmental Laboratory (PMEL) Clear and Cloudy Sky payloads, the NOAA OAR Physical Sciences Laboratory (PSL), together with partners at the Cooperative Institute for Research in Environmental Sciences (CIRES) and Integrated Remote and In Situ Sensing (IRISS) program at the University of Colorado Boulder developed the miniFlux sensor suite for operation on the L3Harris Latitude Fixed Wing Vertical Takeoff and Landing (VTOL) Rotator (FVR-55). miniFlux is a collection of complementary systems and sensors selected to provide robust and accurate measurements of atmospheric thermodynamic and kinematic states. miniFlux carries sensors to make redundant measurements of temperature, humidity, and pressure, in addition to nadir and zenith thermal IR temperatures and sensors to provide a three dimensional wind measurement. In combination, these measurements, combined with accurate inertial position and orientation measurements collected by the miniFlux system, enable for estimation of atmospheric energy transfer conditions.

A large component of forecast uncertainties results from improper model physics. Therefore, improving the representation of physical processes and ultimately, physical parameterizations, is a critical step towards better predictive skill across the weather and climate timescales. High quality measurements of lower atmospheric state and turbulent fluxes over a variety of environments including those that are difficult to reach over the remote ocean is one of the critical observations needed for assessing and improving coupled model physics.
The miniFlux measurements can directly contribute to advancing scientific understanding relevant to NOAA forecasting efforts across the weather and climate timescales. Specifically, information on the vertical distribution of dynamic (momentum) and thermodynamic fields (heat fluxes), spatial and temporal variation of PBL height, formation and maintenance of clouds, and ABL stability can be used to evaluate boundary layer and cloud parameterizations. This to examine and better understand the physical processes supporting the organization of clouds and to provide guidance on model physics development. Improving model physics is one of the major goals articulated in NOAA’s Unified Forecast System (UFS) Goals and Priorities document. In response, NOAA Physical Sciences Laboratory (PSL), Environmental Modeling Center (EMC), Geophysical Fluid Dynamics Laboratory (GFDL), Global Systems Division (GSD) and others are presently involved in the testing and evaluation of UFS model physics.
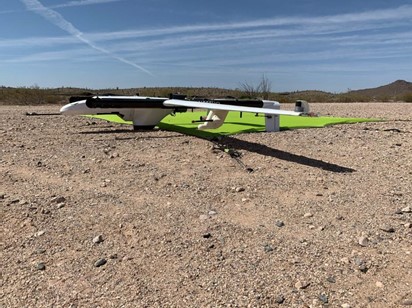
On May 6, 2021 L3Harris and PSL successfully completed payload integration and flight testing at the Florence, AZ test flight area. The miniFlux was mounted on the wing of the FVR-55 (Figure 3).
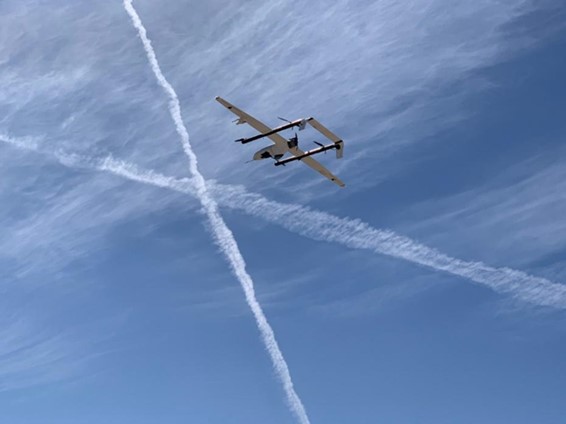
Two flights were performed (Figure 4) which were 1.9 and 2.8 hours in duration completing various test patterns which included the following:
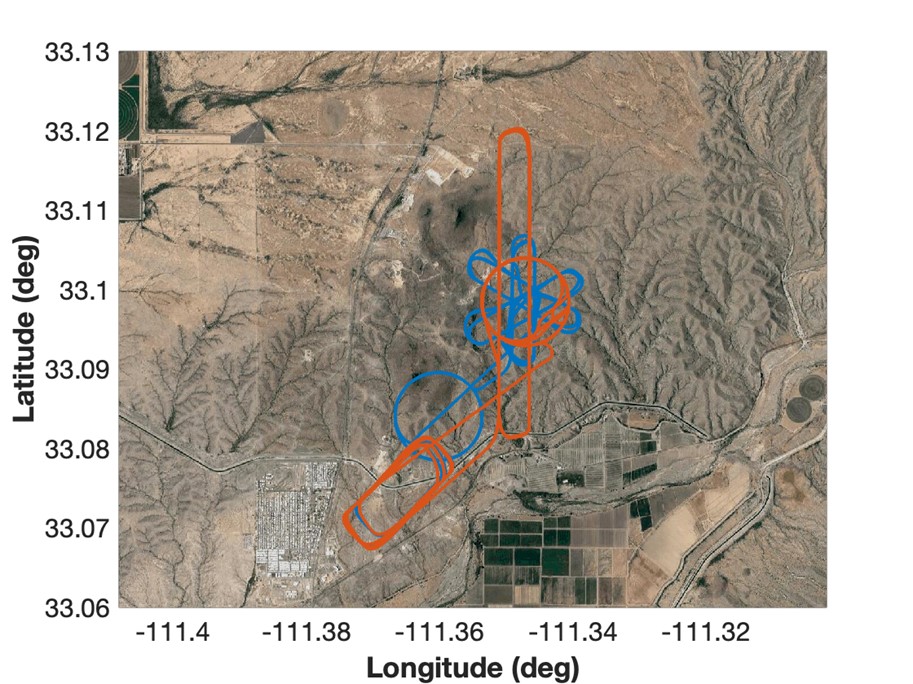
- Flight 1
- Star Pattern (2 Full Patterns Each) 4500 MSL and 9500 MSL
- Right orbit with unrestricted climb from 4500 MSL to 9500 MSL
- o Flight 2
- Porpoise Pattern (5 Full patterns, 3 porpoising about 4500 MSL, 2 held at 4500 MSL)
- Right orbit restricted to 2 m/s (3.89 kts) in climb and descent from 4500 MSL to 8000 MSL
- Left orbit restricted to 1 m/s (1.94 kts) in climb and descent from 4500 MSL to 8000 MSL
- Finished the orbits with two left orbits at 4500 MSL
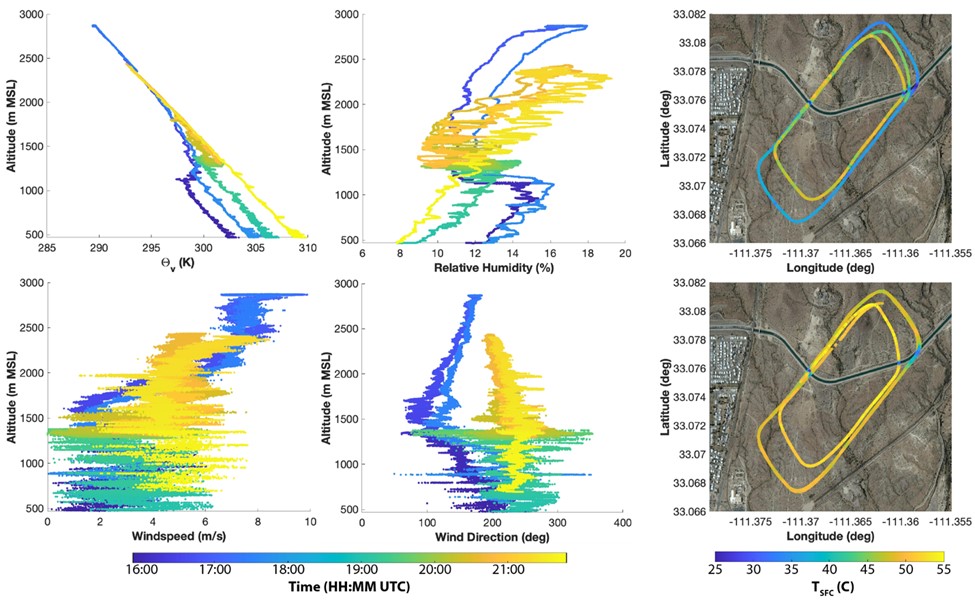
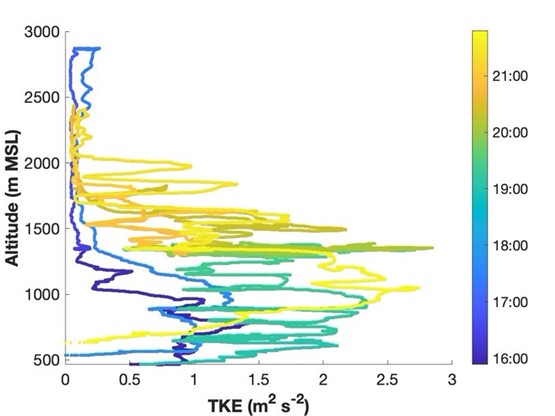
Figure 5 shows an example of data collected by miniFlux. These show a developing convective boundary layer, with temperatures quickly warming throughout the morning and relative humidities decreasing on this hot desert day. The development of convection in the lower atmosphere erodes a low-level inversion that had set up overnight the night before. Wind data show a high level of turbulence in the lower atmosphere, with that turbulent layer deepening throughout the course of the morning. This is corroborated by the miniFlux-observed turbulent kinetic energy (Figure 6) which shows turbulence increasing throughout the day, particularly at higher altitudes. Winds turned throughout the day, starting as east-south-easterly and changing to southwesterly later in the day. The two right hand figures show surface brightness temperatures from portions of the flight conducted at less than 250 m altitude above the surface. There is a notable warming of the surface between the first flight (top) and second flight (bottom). Additionally, the stark temperature contrast between the hot land surface and colder irrigation canal is clearly visible as the aircraft transits over the top of the canal.
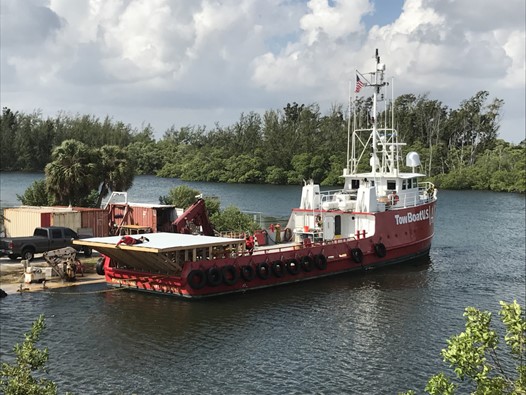
Final engineering checkout is planned with L3Harris FVR-55 and NOAA PMEL and PSL payloads on the Commercial 96′ vessel TowBoatU.S. Richard L. Becker (Figure 7), this summer. NOAA staff from UxSRTO, OMAO UxSOC, PMEL, and PSL will be on the boat as well as the UAS team from L3Harris.